Production possibilities frontiers can be used to illustrate the benefits of specialization and trade. One of the ways a society can become more prosperous is to increase the degree to which it specializes its production in the goods or services it produces relatively well and trades for the other goods and services it needs and wants.
To illustrate this, consider a simple economy with two countries, the United States and China. Consider two products, bicycles and airplanes.
Assume the United States has resources and technology that yield the following production possibilities frontier:If all U.S. resources are devoted to the production of bicycles, it can produce a maximum of 4 million bicycles per year. This is represented in the graph above by point S. Alternatively, if all U.S. resources are devoted to the production of airplanes, it can produce a maximum of 40,000 airplanes per year. This is represented in the graph by point U. If resources are evenly split between the production of bicycles and airplanes, the U.S. could produce 2 million bicycles and 20,000 airplanes at point T. By shifting the allocation of resources between the two industries, the U.S. could produce at any point on or inside its PPF.
Assume China has resources and technology that yield the following production possibilities frontier:If all Chinese resources are devoted to the production of bicycles, it can produce a maximum of 6 million bicycles per year. This is represented in the graph above by point J. Alternatively, if all Chinese resources are devoted to the production of airplanes, it can produce a maximum of 30,000 airplanes per year. This is represented in the graph by point L. If resources are evenly split between the production of bicycles and airplanes, China could produce 3 million bicycles and 15,000 airplanes at point K. By shifting the allocation of resources between the two industries, China could produce at any point on or inside its PPF.
In the absence of trade, each country is forced to consume some combination of products on or inside its production possibilities frontier (PPF). Specialization and trade can improve the standard of living in both countries by allowing each country to consume a combination of products outside its production possibilities frontier. To see this, put the PPFs for the two countries on the same graph as illustrated below:Suppose that in the absence of trade, China produces at point K and the U.S. produces at point T. China produces and consumes 3 million bicycles and 15,000 airplanes. The U.S. produces and consumes 2 million bicycles and 20,000 airplanes.
Now consider the option of complete specialization in both countries. Suppose the U.S. completely specializes in the production of airplanes and produces at point U. This represents the U.S. producing 40,000 airplanes and zero bicycles. Suppose China completely specializes in the production of bicycles and produces at point J. This represents China producing 6 million bicycles and zero airplanes. If the U.S. then exports 20,000 airplanes to China in exchange for 3 million bicycles, both countries can then consume 3 million bicycles and 20,000 airplanes. This is represented in the graph above by point C.
The U.S. produces 40,000 airplanes, but exports 20,000 of them to China. It ends up with 20,000 airplanes. The U.S. produces no bicycles, but imports 3 million of them from China. With specialization and trade, the U.S. consumes 20,000 airplanes and 3 million bicycles.
China produces 6 million bicycles, but exports 3 million of them to the United States. It ends up with 3 million bicycles. China produces no airplanes, but imports 20,000 of them from the United States. With specialization and trade, China consumes 3 million bicycles and 20,000 airplanes.
Both countries are better off than in the absence of trade. Each country is able to consume at a point outside its production possibilities frontier (PPF).
In the absence of trade, China produced and consumed at point K. It had 3 million bicycles and 15,000 airplanes. With specialization and trade, China produces at point J, but consumes at point C. It has 3 million bicycles and 20,000 airplanes. China consumes the same number of bicycles and 5,000 additional airplanes.
In the absence of trade, the United States produced and consumed at point T. It had 2 million bicycles and 20,000 airplanes. With specialization and trade, the U.S. produces at point U, but consumes at point C. It has 3 million bicycles and 20,000 airplanes. The United States consumes an additional 1 million bicycles and the same number of airplanes.
Thus, production possibilities curves can be used to illustrate the benefits of specialization and trade.
An introduction to U.S. macroeconomic policy issues, such as how we use monetary and fiscal policies to promote economic growth, low unemployment, and low inflation.
Monday, April 21, 2008
Sunday, April 20, 2008
Using a PPF to Illustrate the Unemployment
A production possibilities frontier can be used to illustrate how the unemployment or misallocation of resources causes a society to produce fewer goods and services than possible. The diagram above illustrates the production possibilities for the U.S. economy. All products can be divided into two categories. Military products (e.g., guns) are measured on the vertical axis. Civilian products (e.g., butter) are measured on the horizontal axis.
If all U.S. economic resources are fully and efficiently employed in the production of military products, the output of the U.S. economy occurs at point A. If all U.S. economic resources are fully and efficiently employed in the production of civilian products, the output of the U.S. economy occurs at point E. Points B, C, and D (and all other points on the production possibilities frontier) represent possible combinations of military and civilian products that could be produced in the United States if its resources are fully and efficiently employed. Points on the production possibilities frontier are efficient because it is not possible to produce any more output of one product (e.g., guns) with the existing resources unless less output of another product (e.g., butter) is produced.
Points J, K, L, M, and N (and all points a similar distance from the PPF) represent U.S. output when there is relatively low unemployment or relatively low inefficiency. All points inside the PPF are inefficient because it is possible to produce more of one product without sacrificing the output of other products (by employing some of the unemployed resources or using them more productively).
Points S, T, U, V, and W (and all points a similar distance from the PPF) represent U.S. output when there is relatively high unemployment or relatively high inefficiency. Increases in unemployment or inefficiency move the production point further from the PPF (toward the origin) representing less output of goods and services.
Production point Z is not possible with existing resources and technology. (But if additional resources are acquired or technology increases productivity, it may be possible to move the entire PPF in that direction.)
If a societal goal is to satisfy as many needs and wants for material possessions as possible, then a society should strive to produce at a production point on (or close to) the PPF.
Friday, April 18, 2008
Simple Economic Models - Topics for Further Study
INSERT DIAGRAM HERE
TOPICS FOR FURTHER STUDY
1. How would the circular flow diagram change if it also included government? What other flows could be added to make it more realistic?
2. Could a production possibilities curve be concave to the origin? Would the opportunity costs be increasing, decreasing, or constant?
3. Draw a production possibilities frontier for the example on page 54.
4. Draw a production possibilities frontier for the example on page 55.
6 hours x 20 pages of economics per hour = 120 pages of economics
6 hours x 50 pages of history per hour = 300 pages of history
4 hours x 20 pages of economics per hour = 80 pages of economics
4 hours x 50 pages of history per hour = 200 pages of history
6 hours x 20 pages of economics per hour = 120 pages of economics
6 hours x 50 pages of history per hour = 300 pages of history
4 hours x 20 pages of economics per hour = 80 pages of economics
4 hours x 50 pages of history per hour = 200 pages of history
5 hours x 50 pages of history per hour = 250 pages of history
5 hours x 30 pages of economics per hour = 150 pages of economics
Thursday, April 17, 2008
Wednesday, April 16, 2008
A PPF Change that only Shifts One Intercept
INSERT DIAGRAM HERE
An Example of a Change in a PPF that only Shifts One Intercept
Suppose the vertical axis measures the quantity of agricultural products (i.e., food) produced by a society, while the horizontal axis measures the quantity of industrial products (i.e., machines) produced. Suppose there is a technological innovation that affects the production of agricultural products but does not affect the production of industrial products. An example of this might be genetic engineering that provides farmers with seeds which produce more output. With the same number of seeds, the same amount of farmland, the same amount of agricultural machinery and the same number of farmers, farmers are now able to produce more food products than they could before the technological innovation.
This technological change would shift the maximum amount of agricultural output that could be produced to a higher point on the vertical axis. Since the technological change did not affect the production of industrial products, the maximum amount of industrial output that could be produced would remain unchanged. Consequently, the new PPF after the technological change would have the same horizontal intercept, but a new, higher vertical intercept. Note that the new PPF has a steeper slope than the previous one. This tells us that the opportunity cost of industrial products has increased, while the opportunity cost of agricultural products has decreased.
Tuesday, April 15, 2008
Monday, April 14, 2008
Sunday, April 13, 2008
Saturday, April 12, 2008
A PPF with Increasing Opportunity Costs
A PPF with Increasing Opportunity Costs: Alternative Uses of Farmland in the United States
Consider an extreme use of farmland in the United States. Pretend all U.S. farmland is used to grow oranges. Orange trees are planted in the tropical areas, such as Florida and California. In areas less suited to growing oranges, green houses are built to create a tropical environment in which to grow oranges. There is a maximum quantity of oranges that can be produced with the finite amount of farmland and other resources in the United States. This point is illustrated by point A in the graph below. Now suppose the United States considers using some of the farmland to grow wheat instead of oranges. It makes sense to stop growing oranges and begin growing wheat on the farmland that is not well suited for growing oranges but is well suited for growing wheat (perhaps Kansas or Nebraska). In order to gain a billion bushels of wheat, the U.S. must sacrifice a relatively small amount of orange production (2 million tons). It is a relatively small amount of oranges because the land was not well suited for orange production anyway.
INSERT DIAGRAM HERE.
Figure 3-5. A production possibilities frontier (PPF) for U.S. farmland.
Curved PPFs illustrate increasing opportunity costs.
If the U.S. continues to switch farmland out of orange production and into wheat production, then the quantity of oranges produced will go down and the quantity of wheat produced will increase. For each additional ton of wheat produced, however, the sacrifice (in terms of reduced orange production) increases. Land that was a little bit better at growing oranges (such as Oklahoma) will be used to grow wheat. So in order to gain an additional thousand tons of wheat, the U.S. must sacrifice a relatively larger amount of orange production.
Suppose this process continues until the entire country is planted in wheat (point E). This implies bulldozing orange groves in Florida and California to build greenhouses to grow wheat. To obtain those last billion bushels of wheat (moving from point D to point E), the U.S. must sacrifice a relatively large amount of orange production (10 million tons).
In this example, the opportunity cost of producing additional wheat increases as wheat production increases. The amount of orange production that must be foregone in order to produce additional wheat increases as wheat production increases. Thus, this is an example of increasing opportunity costs. Increasing opportunity costs occur when the quantity of one product that must be foregone to obtain a unit of another product increases as more is produced.
Graphically, increasing opportunity costs are illustrated by a production possibilities frontier that is convex to the origin. The slope of the PPF, which represents the opportunity costs, increases as the production point moves down the curve.
Friday, April 11, 2008
Thursday, April 10, 2008
Wednesday, April 9, 2008
Tuesday, April 8, 2008
Monday, April 7, 2008
Things that Shift Production Possibility Frontiers - Farmland example
Things that Shift Production Possibility Frontiers
A PPF can change its shape or positioning if the society gains or loses resources or if there is a change in technology.
An Example of a Change in a PPF that Shifts the Entire Curve
A production possibilities frontier (PPF) illustrates the possible production points for an economy with a given set of resources and technology. If the economy’s resources or technology change, then the production possibilities frontier will change, too. If there is a change in the number of hours devoted to study in the example above, then the PPF will change. For example, if you have six hours of time (instead of five), then the maximum amount of economics you could read is 120 pages (if you devote all six hours to reading economics and spend no time reading history). The maximum quantity of history you could read is 300 pages (if you devote all six hours to reading history and spend no time reading economics). Since one hour can be spent reading 20 pages of economics or 50 pages of history, the opportunity costs of reading economics and history are still constant (20 pages of economics = 50 pages of history). Thus, the PPF is a straight line with the same constant slope. Similarly, if there are only 4 hours of time, then the maximum amount of economics you could read is 80 pages (if you devote all four hours to reading economics and spend no time reading history). The maximum quantity of history you could read is 200 pages (if you devote all four hours to reading history and spend no time reading economics). The graph below illustrates how a change in resources can change the production possibilities frontier for an economy.
PPF for Cowboys - with Constant Opportunity Costs
In this example, we are considering two options for the work done on a ranch in an afternoon. Each cowboy has the ability to store 100 bales of hay in the barn if he devotes the entire afternoon to that activity. Alternatively, each cowboy could build 20 yards of fences if he spent the whole afternoon doing that. Other combinations are also possible. For example, if half of the afternoon is spent storing hay and the other half spent building fences, each cowboy could store 50 bales of hay and build 10 yards of fences. The opportunity costs in this example are constant. Since an afternoon can be spent either storing 100 bales of hay or building 20 yards of fences, the opportunity cost of an afternoon on the ranch is: Storing 100 bales of hay = building 20 yards of fences.
The graph above illustrates how the farm's production possibilities frontier (PPF) shifts further from the origin when the farm's resources increase from one cowboy to two cowboys. The slope of the PPF does not change because the technology (the productive ability of each cowboy) has not changed.
The primary economic lesson to be learned from this example is that an increase in economic resources (labor, capital, or natural resources) increases a society's ability to produce goods and services. If a society wants to increase its quantity of material possessions, one way to achieve this is by acquiring additional resources. This might include a conscious decision to invest more in education, technological research, and physical capital (such as factories and highways) or a change in health care (so workers stay productive longer) or immigration policy.
Movements of the Production Possibilities Frontier
A production possibilities frontier (PPF) illustrates the possible production points for an economy with a given set of resources and technology. If the economy’s resources or technology change, then the production possibilities frontier will change, too.
Changes in Resources or Technology Shift or Pivot a Production Possibility Frontier: Study Time Example
A PPF can change its shape or positioning if the society gains or loses resources or if there is a change in technology.
A Parallel Shift of the Entire Curve Due to a Change in Resources, but No Change in Technology
If there is a change in the number of hours devoted to study in the example above, then the PPF will change. For example, if you have six hours of time (instead of five), then the maximum amount of economics you could read is 120 pages (if you devote all six hours to reading economics and spend no time reading history). The maximum quantity of history you could read is 300 pages (if you devote all six hours to reading history and spend no time reading economics). Since one hour can be spent reading 20 pages of economics or 50 pages of history, the opportunity costs of reading economics and history are still constant (20 pages of economics = 50 pages of history). Thus, the PPF is a straight line with the same constant slope. Similarly, if there are only 4 hours of time, then the maximum amount of economics you could read is 80 pages (if you devote all four hours to reading economics and spend no time reading history). The maximum quantity of history you could read is 200 pages (if you devote all four hours to reading history and spend no time reading economics). The graph above illustrates how a change in resources can change the production possibilities frontier for an economy.
One of the ways an economy can become more prosperous is to acquire additional economic resources. The quantity of labor can increase through population increases from higher birth rates, health care innovations that extend the average life span, or immigration. Increases in capital typically occur through conscious investment in physical capital, human capital (education), and technology. Natural resources can be increased if the renewable ones (such as forests) are well managed. Despite moral and ethical concerns, history has numerous examples of societies that increased their labor, capital, and natural resources through the conquest, plunder, and enslavement of other people.
A Parallel Shift of the Entire Curve Due to a Change in Technology, but No Change in Resources
A change in technology also shifts a production possibilities frontier (PPF). For this example, assume the resources under consideration are always five hours of study time. The initial technology is the same as in the example above. You are able to read a maximum of 20 pages of economics in an hour or a maximum of 50 pages of history per hour. In the five hours of study time, you could read a maximum of 100 pages of economics if all five hours are devoted to it. Alternatively, if all five hours are spend reading history, you could read a maximum of 250 pages.
Now suppose a tutor improves your ability to read all subjects. Suppose the tutor provides you with techniques and strategies that allow you to read all subjects 10 percent faster. Now you are able to read 22 pages of economics in an hour (instead of 20) and you can read 55 pages of history in an hour (instead of 50). The effect of this technological improvement (i.e., your ability to read) is that the production possibilities frontier (PPF) shifts further from the origin. Now, the maximum number of pages of economics that can be read in five hours is 110 pages. Alternatively, if all five hours are spent reading history, you could read a maximum of 275 pages.
Technological innovation shifts a production possibilities frontier (PPF) even if there are no changes in resources. Module 6 elaborates on how one of the keys to economic growth is investment in technology so a society can obtain more goods and services from a given set of economic resources.
An Example of a Change in a PPF that Pivots the Curve, Rather than Shifting It
A change in technology can also pivot the production possibilities frontier for an economy. Suppose you work with an economics tutor who helps you read your economics textbook faster. You now can read 22 pages of economics per hour. The tutor does not improve your ability to read history. You still read 50 pages of history per hour. In five hours of time, the maximum amount of history you can read is still 250 pages (if you devote all five hours to reading history and spend no time reading economics) . The maximum amount of economics you can read is now 110 pages (if you devote all five hours to reading economics and spend no time reading history).
Notice that the production possibilities frontier has pivoted rather than making a parallel shift. Because the new PPF has a different slope than the original one, the new opportunity cost must be different than the previous one. Now an hour of study time can be used to read 22 pages of economics or 50 pages of history. So the opportunity cost of reading 50 pages of history has increased to 22 pages of economics. Previously, the opportunity cost of reading 50 pages of history was only 20 pages of economics.
Changes in production possibilities frontiers are not always uniform or symmetric. If the technological innovation affects only one of the products in a PPF, the result is a pivoting of the curve rather than a shift.
Test Your Understanding - Can you draw the changes in the PPF for this example?
Suppose one cowboy can put 100 bales of hay in the barn in an afternoon of work. Alternatively, if the cowboy spends the afternoon building pasture fences, he can build 20 yards of fencing.
If we plot bales of hay on the vertical axis and yards of fencing on the horizontal axis, we could draw a PPF as a straight line from a point representing 100 bales on the vertical axis to a point representing 20 yards on the horizontal axis.
Now suppose a second cowboy with the same abilities assists the first cowboy with the ranch chores. Now, if both cowboys spend the afternoon putting hay in the barn, they could store 200 bales (100 bales per afternoon per cowboy times two cowboys). Alternatively, if both cowboys spend the afternoon putting up fences, they could build 40 yards of fencing (20 yards per afternoon per cowboy times two cowboys). Now we could draw a PPF as a straight line from a point representing 200 bales on the vertical axis to a point representing 40 yards on the horizontal axis. Because we now have more resources (two cowboys instead of one), the PPF shifts further from the origin.
CLICK HERE FOR THE DIAGRAM.
A change in technology also could shift the entire PPF if the technological change affects the products on both axes of the diagram.
Sunday, April 6, 2008
A PPF with Constant Opportunity Costs
Other Examples of Production Possibilities Frontiers (PPFs)
A PPF with Constant Opportunity Costs: Alternative Uses of Study Time
Suppose you are trying to decide how to spend the five hours between 7:00 p.m. and midnight. When you study economics, you can read 20 pages of your textbook each hour. By contrast, you can read 50 pages of your history textbook each hour. You could also spend part of the time reading magazines, watching television, talking on the telephone, or something else. A production possibilities frontier can be used to illustrate your options for spending these five hours. Let the vertical axis of a graph be used to measure the number of pages of your economics textbook you read. Let the horizontal axis measure the number of pages of your history textbook you read.
INSERT DIAGRAM HERE
Figure 3. A production possibilities frontier (PPF) for a student with five hours of study time. Straight-line PPFs illustrate constant opportunity costs.
If you spend all five hours reading your economics book, the maximum number of pages you could read is 100. (Five hours multiplied by 20 pages per hour equals 100 pages.) This is illustrated by point A in the graph. In this case, you cannot read any pages of your history book (because you are spending all five hours reading economics).
If you spend four hours reading your economics textbook and one hour reading your history book, you could read a maximum of 80 pages of economics and a maximum of 50 pages of history. This is illustrated by point B in the graph. Note that by reducing the amount of time spent reading your economics text, you lose the opportunity to read 20 pages of economics, but gain the opportunity to read 50 pages of history. The opportunity cost of reading 50 pages of history is the loss of the ability to read those additional 20 pages of economics.
If you spend three hours reading your economics book and two hours reading your history text, you could read a maximum of 60 pages of economics and a maximum of 100 pages of history. This is illustrated by point C in the graph. Note that by reducing the amount of time spent reading your economics book by one more hour, you lose the ability to read 20 pages of economics, but gain the opportunity to read 50 more pages of history. The opportunity cost of reading 50 additional pages of history is the loss of the ability to read 20 additional pages of economics.
If you spend two hours reading your economics textbook and three hours reading your history book, you could read a maximum of 40 pages of economics and a maximum of 150 pages of history. This is illustrated by point D in the graph. Again note that by reducing the amount of time spent reading your economics book by one more hour, you the lose the ability to read 20 pages of economics, but gain the opportunity to read 50 more pages of history. The opportunity cost of reading 50 additional pages of history is the loss of the ability to read 20 pages of economics.
If you only spend one hour reading your economics text and four hours reading your history book, you could read a maximum of 20 pages of economics and a maximum of 200 pages of history. This is illustrated by point E in the graph. By reducing the amount of time spent reading your economics book by one more hour, you lose the ability to read 20 pages of economics, but gain the opportunity to read 50 more pages of history. The opportunity cost of reading 50 additional pages of history is the loss of the ability to read 20 pages of economics.
If you spend all five hours reading your history book, the maximum number of pages you could read is 250. This is illustrated by point F in the graph. By reducing the amount of time spent reading your economics book by one more hour, you lose the ability to read 20 pages of economics, but gain the opportunity to read 50 more pages of history. The opportunity cost of reading 50 additional pages of history is the loss of the ability to read 20 pages of economics.
When these points are plotted on a graph, they can be connected to form a straight line that intersects the vertical axis at 100 pages of economics and intersects the horizontal axis at 250 pages of history. Any point on this line between the intercepts represents a possible combination of pages of economics and history which could be read if all five hours are devoted to reading economics and history. By spending more time reading history and less time reading economics, you can increase the number of pages of history you could read but must sacrifice some of the pages of economics you could read. Conversely, by spending more time reading economics and less time reading history, you can increase the number of pages of economics you could read but must sacrifice some of the pages of history you could read. This illustrates the concept of opportunity cost. If you choose to spend an hour reading 20 pages of economics, you forego the opportunity to spend that same hour reading 50 pages of history. The opportunity cost of reading 20 pages of economics is the 50 pages of history you forego reading. Similarly, if you spend an hour reading 50 pages of history, you forego the opportunity to spend that hour reading 20 pages of economics. The opportunity cost of reading 50 pages of history is the 20 pages of economics you forego reading.
In this simple example, there are constant opportunity costs. Constant opportunity costs occur when the quantity of one product that must be foregone to obtain a unit of another product is the same, regardless of how much has already been produced. Regardless of where you are on the PPF, the opportunity costs are the same. For each additional page of economics read, you forego the opportunity to read two and a half pages of history. (If you can spend one hour reading either 20 pages of economics or 50 pages of history, then you could spend 1/20 of an hour reading one page of economics (20/20 = 1) or two and a half pages of history (50/20 = 2 ½). Similarly, for each additional page of history read, you forego the opportunity to read 2/5 of a page of economics. (If you can spend one hour reading either 50 pages of history or 20 pages of economics, then you could spend 1/50 of an hour reading one page of history (50/50 = 1) or two-fifths of a page of economics (20/50 = 2/5). Graphically, constant opportunity costs are illustrated by a straight-line production possibilities frontier (PPF). The slope of the PPF, which measures the opportunity cost, is constant all along the PPF. Thus, any PPF that is a straight-line segment has constant opportunity costs.
It is impossible to produce at a point outside the production possibilities frontier. For example, you cannot read 80 pages of economics and 200 pages of history (point Z) in the same five hours. It is possible to produce at any point inside the PPF, however. For example, you could read 20 pages of economics and 50 pages of history (point S) and spend the other three hours doing something else. You could even produce at the origin (point W) and not read any economics or history.
A frontier is an edge or boundary. A production possibilities frontier separates attainable production points from those that are unattainable.
The points on the production possibilities frontier are efficient. Efficiency occurs when one achieves the largest possible output from a given set of resources. In this example, the set of resources is five hours of your time (i.e., labor). At any point on the PPF, it is impossible to read more pages of one subject without sacrificing pages of the other subject. Points inside the PPF are not efficient, however. For example, at point N, you spend two hours reading economics and one hour reading history. This point is not efficient because it would be possible to read more pages of economics or history simply by spending more of the five hours studying.
INSERT DIAGRAM HERE
Figure 4. An illustration of attainable, unattainable, and efficient points on a production possibilities diagram.
Saturday, April 5, 2008
The Production Possibilities Frontier (PPF)
Economic Model #2: The Production Possibilities Frontier
The production possibilities frontier (PPF) is a model that can be used to illustrate scarcity, tradeoffs, opportunity costs and the benefits of specialization and trade.
A production possibilities frontier (PPF) is a diagram that illustrates the possible production points for an economy based on its resources and technology. A frontier is a boundary. The wild frontier in American history refers to the boundary between civilization and the parts of the country that were not yet settled. A PPF is the boundary between combinations of output that are possible with current resources and technology and those output combinations that are not possible. The production possibilities curve (PPC) is another name for the PPF.
INSERT DIAGRAM HERE.
Figure 3-2. A Production Possibilities Frontier (PPF) for an economy than can produce guns (or more generally, military products) and butter (or more generally, civilian products).
A PPF can illustrate two types of output. For example, Figure 2 illustrates a production possibilities frontier where the two outputs are guns (or more generally, military products) and butter (or more generally, civilian products). The quantity of one output is graphed on the horizontal (X) axis and the quantity of the other output is graphed on the vertical (Y) axis. For example, in Figure 3-2, the quantity of guns (military products) is graphed on the vertical (Y) axis and the quantity of butter (civilian products) is graphed on the horizontal (X) axis.
Production points on a PPF are possible and efficient. Production points on a PPF represent efficient use of all of the economy’s resources. It is impossible to produce more of one product (measured on one axis) without producing less of the other product (measured on the other axis).
Production points inside a PPF are possible, but inefficient. Production points inside a PPF indicate the economy is either not using all of its resources (e.g., there is unemployment) or is using them inefficiently (e.g., growing oranges in Kansas and wheat in Florida).
Points outside the PPF are unattainable production points given current resources and technologies. It is impossible for an economy to produce outside its PPF. The PPF can change, however, with changes in resources or technology. Additional resources and improvements in technology push the PPF further away from the origin. A loss of resources moves the PPF toward the origin.
Points outside the PPF might be attainable consumption points, however. Consumption points outside the PPF may be obtained through specialization and trade if there is a willing trading partner.
The production possibilities frontier (PPF) is a model that can be used to illustrate scarcity, tradeoffs, opportunity costs and the benefits of specialization and trade.
A production possibilities frontier (PPF) is a diagram that illustrates the possible production points for an economy based on its resources and technology. A frontier is a boundary. The wild frontier in American history refers to the boundary between civilization and the parts of the country that were not yet settled. A PPF is the boundary between combinations of output that are possible with current resources and technology and those output combinations that are not possible. The production possibilities curve (PPC) is another name for the PPF.
INSERT DIAGRAM HERE.
Figure 3-2. A Production Possibilities Frontier (PPF) for an economy than can produce guns (or more generally, military products) and butter (or more generally, civilian products).
A PPF can illustrate two types of output. For example, Figure 2 illustrates a production possibilities frontier where the two outputs are guns (or more generally, military products) and butter (or more generally, civilian products). The quantity of one output is graphed on the horizontal (X) axis and the quantity of the other output is graphed on the vertical (Y) axis. For example, in Figure 3-2, the quantity of guns (military products) is graphed on the vertical (Y) axis and the quantity of butter (civilian products) is graphed on the horizontal (X) axis.
Production points on a PPF are possible and efficient. Production points on a PPF represent efficient use of all of the economy’s resources. It is impossible to produce more of one product (measured on one axis) without producing less of the other product (measured on the other axis).
Production points inside a PPF are possible, but inefficient. Production points inside a PPF indicate the economy is either not using all of its resources (e.g., there is unemployment) or is using them inefficiently (e.g., growing oranges in Kansas and wheat in Florida).
Points outside the PPF are unattainable production points given current resources and technologies. It is impossible for an economy to produce outside its PPF. The PPF can change, however, with changes in resources or technology. Additional resources and improvements in technology push the PPF further away from the origin. A loss of resources moves the PPF toward the origin.
Points outside the PPF might be attainable consumption points, however. Consumption points outside the PPF may be obtained through specialization and trade if there is a willing trading partner.
Friday, April 4, 2008
The Circular Flow Diagram
Economic Model #1: The Circular-Flow Diagram
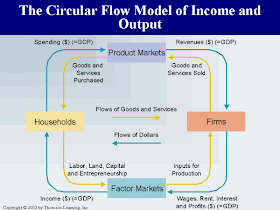
One model that helps explain how a market economy works is a circular-flow diagram. A circular-flow diagram is a visual model of the economy that illustrates how households and businesses interact through markets for products and markets for resources. A simple circular-flow diagram is illustrated in Figure 1.
The two types of economic agents in a simple market economy are households and business firms. A household is a social unit comprised of those living together in the same dwelling. A business or business firm is a company that produces goods or services, usually in an effort to make a profit. Profit is revenues minus expenses. Revenues are the monetary income received by a business in exchange for goods or services. Expenses are the total costs of the production of goods or services by a business.
Households interact with business firms it two distinct ways:
(1) households supply economic resources, such as labor, to businesses in exchange for income, and (2) households use their incomes to buy goods and services produced and sold by business firms. The first type of interaction occurs in markets for resources. The second type of interaction occurs in markets for products.
The top half of the circular-flow diagram, which represents product markets, shows that households give money to businesses in exchange for goods and services. Money flows counterclockwise, while the goods and services flow clockwise. In markets for products, businesses usually are the suppliers and households usually are the demanders. The money that flows from households to business firms is consumption spending from the perspective of households and is revenue from the perspective of business firms. The products that flow from business firms to households are sales by the business firms and purchases by household consumers.
The bottom half of the circular-flow diagram, which represents resource markets, shows that businesses give money to households in exchange for economic resources used as factors of production. For example, when people work for a business, they are supplying their labor as a factor of production. In exchange for their labor, households are paid wages and salaries by businesses. This is illustrated by the counterclockwise flow of money and the clockwise flow of economic resources. In markets for economic resources, households usually are the suppliers and businesses usually are the demanders. The monies that flow from business firms to households are expenditures from the perspective of business firms and incomes from the perspective of households. The labor, capital, and natural resources that flow from households to business firms are sources of income from the perspective of households and inputs from the perspective of businesses. Inputs are also called factors of production because they are used by businesses to produce goods and services.
Labor is an economic resource that every household adult can potentially supply in the markets for resources. Wages are the payments made to workers in exchange for labor, typically based upon the amount of time worked or amount of output produced. A salary is a fixed payment made regularly to a worker in exchange for labor. Blue-collar workers typically receive wages. White-collar workers are typically paid salaries.
When workers receive more income than they spend on the purchases of goods and services, they are able to create savings. Savings are the portion of a person’s income that is retained or invested for use in the future. Household savings can become financial capital if the money is borrowed by a business firm. For example, money that is deposited by households in a bank savings account might be loaned by the bank to a business that needs to borrow funds to build a new factory or purchase new equipment. When this occurs, the business firm pays interest to the bank for the borrowed funds. Interest is a rate of return that represents compensation from the borrower or receiver of funds to the lender or depositor of the funds. The bank, in turn, pays interest to the householders for the funds deposited in the savings accounts. Consequently, other transactions that occur in resource markets are the supply of financial capital by households in exchange for interest income.
If households own natural resources, such as land, they can supply them to businesses in exchange for rent payments.
In the next module (Supply & Demand Analysis), it is important to remember the relationships between households and business firms that are illustrated in a circular flow diagram. In product markets, business firms supply and sell goods and services while households demand and buy them. In resource markets, the relationship is reversed. Households supply and sell factors of production, such as labor, while business firms demand and buy them.
Thursday, April 3, 2008
Simple Economic Models
When developing their perspectives on social policies, economists sometimes use models, which range from extremely simplistic to tremendously complex. Some of the most basic economic principles can be illustrated with relatively simple and straightforward models. Introductory economics courses focus on these simple models.
Paper airplane models make extremely simplifying assumptions about the real world to illustrate basic principles that underlie complex phenomena. Economists use models to help understand the complexities of economic issues. Particularly in introductory economics, these models are extremely simplistic and do not resemble the real world. This does not mean we cannot learn basic economic principles from them, however.
Wednesday, April 2, 2008
Simple Economic Models - Learning Objectives
After studying this module, you should be able to:
• define paper airplane models.
• draw, label, and explain a circular-flow diagram.
• illustrate opportunity costs using a production possibilities frontier (PPF) diagram.
• illustrate unemployment using a PPF diagram.
• illustrate full employment using a PPF diagram.
• illustrate production inefficiencies using a PPF diagram.
• illustrate the effect of changes in resources or technology on a PPF.
• illustrate the benefits of specialization and trade using a PPF diagram.
Tuesday, April 1, 2008
Simple Economic Models - Topics
Click on the hyperlinks below to go to a portion of the blog devoted to that topic:
Simple Economic Models - Learning Objectives
Simple Economic Models
The Circular Flow Diagram
The Production Possibilities Frontier (PPF)
A PPF with Constant Opportunity Costs
Movements of the Production Possibilities Frontier
An Increase in Resources
A Decrease in Resources
Technological Innovation
A PPF Change that only Shifts One Intercept
A PPF with Increasing Opportunity Costs
An Increase in Resources
A Decrease in Resources
Technological Innovation
A PPF Change that only Shifts One Intercept
Using a PPF to Illustrate the Benefits of Specialization and Trade
Topics for Further Study